Search for Indicators
Priority: Immunizations & Infectious Disease
UNC Lenoir Health Care aims to reduce the cases of infectious diseases.
Indicator Gauge Icon Legend
Legend Colors
Red is bad, green is good, blue is not statistically different/neutral.
Compared to Distribution
 the value is in the best half of communities.
 the value is in the 2nd worst quarter of communities.
 the value is in the worst quarter of communities.
Compared to Target
 meets target;
  does not meet target.
Compared to a Single Value
 lower than the comparison value;
 higher than the comparison value;
 not statistically different from comparison value.
Trend

 non-significant change over time;
 significant change over time;
  no change over time.
Compared to Prior Value
 higher than the previous measurement period;
 lower than the previous measurement period;
 no statistically different change from previous measurement period.
 Significantly better than the overall value
 Significantly worse than the overall value
 Significantly different than the overall value
 No significant difference with the overall value
 No data on significance available
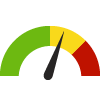
COVID-19 Daily Average Case-Fatality Rate
Value
Compared to:
COVID-19 Daily Average Case-Fatality Rate County: Lenoir
COVID-19 Daily Average Case-Fatality Rate County: Lenoir
0.0
Deaths per 100 cases
(Mar 3, 2023)
Compared to:
NC Counties
(Jan 13, 2023)
The distribution is based on data from 100 North Carolina counties.
U.S. Counties
(Mar 25, 2022)
The distribution is based on data from 2,811 U.S. counties and county equivalents.
NC Value
(1.7)
The regional value is compared to the North Carolina State value.
US Value
(1.7)
The regional value is compared to the national value.
Prior Value
(0.0)
Prior Value compares a measured value with the previously measured value. Confidence intervals were not taken into account in determining the direction of the comparison.
Trend
This comparison measures the indicator’s values over multiple time periods.<br>The Mann-Kendall Test for Statistical Significance is used to evaluate the trend<br>over 4 to 10 periods of measure, subject to data availability and comparability.
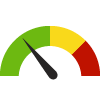
COVID-19 Daily Average Incidence Rate
Value
Compared to:
COVID-19 Daily Average Incidence Rate County: Lenoir
COVID-19 Daily Average Incidence Rate County: Lenoir
28.32
Cases per 100,000 population
(Mar 3, 2023)
Compared to:


NC Counties
The distribution is based on data from 100 North Carolina counties.
U.S. Counties
The distribution is based on data from 3,142 U.S. counties and county equivalents.
NC Value
(10.39)
The regional value is compared to the North Carolina State value.
US Value
(10.97)
The regional value is compared to the national value.
Prior Value
(23.82)
Prior Value compares a measured value with the previously measured value. Confidence intervals were not taken into account in determining the direction of the comparison.
Trend
This comparison measures the indicator’s values over multiple time periods.<br>The Mann-Kendall Test for Statistical Significance is used to evaluate the trend<br>over 4 to 10 periods of measure, subject to data availability and comparability.
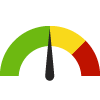
Persons Fully Vaccinated Against COVID-19
Value
Compared to:
Persons Fully Vaccinated Against COVID-19 County: Lenoir
Persons Fully Vaccinated Against COVID-19 County: Lenoir
58.8%
(May 10, 2023)
Compared to:

NC Counties
The distribution is based on data from 100 North Carolina counties.
U.S. Counties
The distribution is based on data from 3,125 U.S. counties and county equivalents.
Prior Value
(58.8%)
Prior Value compares a measured value with the previously measured value. Confidence intervals were not taken into account in determining the direction of the comparison.
Trend
This comparison measures the indicator’s values over multiple time periods.<br>The Mann-Kendall Test for Statistical Significance is used to evaluate the trend<br>over 4 to 10 periods of measure, subject to data availability and comparability.
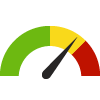
Age-Adjusted Death Rate due to Influenza and Pneumonia
Value
Compared to:
Age-Adjusted Death Rate due to Influenza and Pneumonia County: Lenoir
Age-Adjusted Death Rate due to Influenza and Pneumonia County: Lenoir
16.2
Deaths per 100,000 population
(2017-2021)
Compared to:
NC Counties
(2016-2020)
The distribution is based on data from 100 North Carolina counties.
NC Value
(15.1)
The regional value is compared to the North Carolina State value.
US Value
(13.0 in 2020)
The regional value is compared to the national value. The source for the national value is Centers for Disease Control and Prevention
Prior Value
(16.3)
Prior Value compares a measured value with the previously measured value. Confidence intervals were not taken into account in determining the direction of the comparison.
Trend
This comparison measures the indicator’s values over multiple time periods.<br>The Mann-Kendall Test for Statistical Significance is used to evaluate the trend<br>over 4 to 10 periods of measure, subject to data availability and comparability.
Healthy NC 2020 Target
(13.5)
Age-Adjusted Death Rate due to HIV
Value
Compared to:
Age-Adjusted Death Rate due to HIV County: Lenoir
Age-Adjusted Death Rate due to HIV County: Lenoir
2.7
Deaths per 100,000 population
(2017-2021)
Compared to:
NC Counties
(2016-2020)
The distribution is based on data from 100 North Carolina counties.
NC Value
(1.6)
The regional value is compared to the North Carolina State value.
US Value
(1.4 in 2020)
The regional value is compared to the national value. The source for the national value is Centers for Disease Control and Prevention
Prior Value
(3.1)
Prior Value compares a measured value with the previously measured value. Confidence intervals were not taken into account in determining the direction of the comparison.
Trend
This comparison measures the indicator’s values over multiple time periods.<br>The Mann-Kendall Test for Statistical Significance is used to evaluate the trend<br>over 4 to 10 periods of measure, subject to data availability and comparability.
HIV Diagnosis Rate
Value
Compared to:
HIV Diagnosis Rate County: Lenoir
HIV Diagnosis Rate County: Lenoir
14.4
Cases per 100,000 population
(2020-2022)
Compared to:
NC Counties
The distribution is based on data from 99 North Carolina counties.
NC Value
(14.4)
The regional value is compared to the North Carolina State value.
Prior Value
(14.3)
Prior Value compares a measured value with the previously measured value. Confidence intervals were not taken into account in determining the direction of the comparison.
Trend
This comparison measures the indicator’s values over multiple time periods.<br>The Mann-Kendall Test for Statistical Significance is used to evaluate the trend<br>over 4 to 10 periods of measure, subject to data availability and comparability.
Healthy NC 2020 Target
(22.2)
Healthy NC 2030 Target
(6)
Syphilis Incidence Rate
Value
Compared to:
Syphilis Incidence Rate County: Lenoir
Syphilis Incidence Rate County: Lenoir
34.8
Cases per 100,000 population
(2022)
Compared to:
NC Counties
The distribution is based on data from 100 North Carolina counties.
NC Value
(23.1)
The regional value is compared to the North Carolina State value.
US Value
(17.7)
The regional value is compared to the national value.
Prior Value
(16.5)
Prior Value compares a measured value with the previously measured value. Confidence intervals were not taken into account in determining the direction of the comparison.
Trend
This comparison measures the indicator’s values over multiple time periods.<br>The Mann-Kendall Test for Statistical Significance is used to evaluate the trend<br>over 4 to 10 periods of measure, subject to data availability and comparability.
